注: 本文主要参考 Finding Alphas: A Quantitative Approach to Building Trading Strategies (2th).Igor_Tulchinsky_et_al. (2020)
文档见文末
距离第一次听到Igor的名字,已经过去5年多。WQ被诟病的地方很多,但不得不承认,在多因子的路上,给了很多人启蒙,并且,开放了大量的资源在普及这套国外对冲基金行业已经发展成熟的模式。
拿到这本书的第二版,目录上看到很多熟悉的名字。从业这几年,在个人选择和精力投入上有些偏颇,打算慢慢空下来,认真读一读、想一想。
大的目录分了三部分:
- PART I INTRODUCTION
- PART II DESIGN AND EVALUATION
- PART III EXTENDED TOPICS
目前看完partII, 内容较多,关于前两个part的内容,将拆四篇介绍:
- (1) glance at basic concepts
- (2) alpha risks
- (3) GA & ML alphas
- (4) rs toolkit
- (5) tbd…
顺序上与书目录保持一致,也会照书目录捋一遍,记录些关键词句,方便大家参照。夹杂一些自己的看法。
本篇glance at basic concepts,将书中较大篇幅介绍基础的alpha思想,体系,框架设计的部分,简要融合和介绍。
包括:
- alpha包含哪些内容(4)
- 5dr的简单例子(5)
- alpha和data的关系(6)
- 如何看待换手(7)
- 相关性分析(8)
- 回测的过拟合和偏差问题(9,10)
- TAP框架(11)
- 提高鲁棒性(12)
PART I INTRODUCTION
这部分简单介绍了alpha体系和研究alpha的一些方向、原则性指导。cutting losses部分讲了alpha的失效,和止损的必要性。
1 Introduction to Alpha Design
2 Perspectives on Alpha Research
3 Cutting Losses
principle of unrule. cutting losses means abandoning rules that no longer work.
- A drawdown exceeds the typical drawdowns observed previously.
- The strategy’s Sharpe ratio falls significantly.
- Rules that were initially observed in historical simulation are no longer valid in live trading.
PART II DESIGN AND EVALUATION
4 Alpha Design
Data -> Universe -> Frequency -> Alpha Value -> Evaluate Alpha
Data
Alphas are fueled by data. The edge sought for an alpha may come from identifying high-quality pieces of publicly available data, superior processing of the data or both.
- Prices and volumes. Technical analysis or regression models may be built based on this data.
- Fundamentals. By automating the analysis of key metrics for each company, you can build alphas that typically have very low turnover.
- Macroeconomic data, such as GDP numbers and employment rates,that have market-wide effects upon their release.
- Text, such as Federal Open Market Committee minutes, company filings, papers, journals, news, or social media.
- Multimedia, notably relevant videos or audio. There are mature techniques to process such data. for example, converting audio into text that can be used to build models.
Sometimes data sources aren’t used to generate a directional signal but to attempt to reduce noise in predictions and refine other alpha signals.
- Risk factor models. By controlling risk exposure or eliminating exposure to some risk factors, one can seek to improve the alpha’s performance.
- Relationship models, such as instruments that typically are correlated with each other to some extent. Some may lead or lag others, thus generating potential opportunities for arbitrage.
Universe
Freq
- Tick. New predictions are triggered by events such as a trade in the market.
- Intraday. Predictions are generated multiple times at predetermined points during the day.
- Daily. One prediction per day, of which there are several typical subtypes:
- Delay 1. Only data available before the current trading day may be used to make a prediction.
- Delay 0 snapshot. Data before a specific time may be used to make a prediction.
- MOO/MOC. Predictions are tied to the opening or closing auction.
- Weekly or monthly.
Alpha Value
test of alpha value is how much risk-adjusted profit the alpha adds to the strategy in which it is trading. In practice, this is difficult to precisely measure because:
- There is no canonical strategy in which an alpha may be used, and the exact strategy in which the alpha will be used may not be known at the time of its design.
- There are often nonlinear effects in the combination that make it difficult to precisely attribute profit to individual alphas.
Evaluate Alpha
按流动性切片,按univ切片,按long,short切片
- IR: over a five-year period, would be 1.0
- BP: 5
- Corr with others
- More than 0.7: Too high unless the alpha is significantly better than the existing alpha.
- 0.5 to 0.7: Borderline. The alpha should be exceptional in some other metric.
- 0.3 to 0.5: Generally acceptable.
- Less than 0.3: Good.
5 How to Develop an Alpha: A Case Study
讲了一个5dr例子,包括简单的变换op如何操作
6 Data and Alpha Design
data itself can inspire alpha ideas– every alpha idea is associated with some sort of data
new dataset, it will inspire new ideas and new ways of using the dataset. Ideally, the alpha signals found in the new dataset will have a low correlation to signals that are based on different types of data. By using new data, we may achieve both performance improvement and diversification.
vendor提供的data的分类
- data is simple, vendors may provide only the raw data they have collected, such as price and volume
- do parsing and processing - unstructured yet sophisticated data, such as news, Twitter posts, and so on, vendors typically apply natural language processing techniques to analyze the content of the raw data
- even sell alpha models directly
Data validation
check the data’s usability.
- delivery time: data is useless if it does not have a timestamp -> forward-looking bias.
- ensure that the data can support alpha production: data producer will cease to generate the data
- survival bias: some out-of-sample testing period for the dataset might be useful. Out-of-sample testing is helpful because it is not conducted in a controlled universe and strong performance is a good indicator of an alpha’s robustness
关注数据的时间戳,确保数据可以日常稳定生产,以及提供model的vendor要留一段os来避免幸存偏差。
removing outliers in the alpha code
many interesting ideas
- Kamstra et al. (2002) presented a “SAD” (seasonal affective disorder) effect: stock market returns vary seasonally with the length of the day.
- Hirshleifer and Shumway (2003) found that the morning sunshine at a country’s leading stock exchange could predict the market index returns that day.
- Preis et al. (2013) made use of Google trend data to develop an alpha that beat the market significantly: a 326% return versus a 16% return.
More data is always better, as long as we can handle it. It is very challenging to manage the rapid growth of data. There may be cost con- siderations for storage devices, computing machines, customized data- bases, and so forth. Yet, if data can be used correctly and efficiently, we can target better alphas.
7 Turnover
交易成本是现实的一个约束,本篇比较了不同换手的alpha在纳入交易成本之后的实际表现,与不考虑交易成本得到的结果差异。
real-world constraints. We assume liquidity is endless, trading is free, and there are no other market participants but ourselves.
The ability to take advantage of rapidly changing information and react accordingly typically increases the quality of the prediction. Similarly, in alpha research we expect a higher-turnover alpha with a shorter fore- cast horizon to have better predictive power than a lower-turnover, longer-term alpha.
an individual alpha is too weak and unlikely to perform well as a strategy on its own; to build a potentially profitable trading strategy, a portfolio manager generally needs to combine multiple alphas. Combining many diverse alphas results in a stronger, more informed prediction that is more likely to overcome transaction costs and other trading constraints.
换手的来源,和降低换手的方法
(1) not all types of information change at the same rate, and (2) not all information is particularly useful.This suggests that the alpha may be trading into the position very quickly and potentially trading out too soon.
Thus, even naturally low-turnover alphas may have room for improvement by smoothing the data and spreading out the trading over a longer period.
First, it is useful to determine whether very large values in the data are meaningful or if they are just anomalies (i.e. outliers).
- clamp (data, min_value, max_value)
- percentile of the data distribution or some number of standard deviations.
处理一些数据的微小变化带来的不必要的换手
smallest changes in the data that cause unnecessary trading.assumption here is that these small movements are just noise that we need to remove from our data.
hump
require the change to exceed a threshold (or “hump”) and otherwise preserve the previous value.decay
trades can be smoothed (decayed) rather than stopped completely by using an exponential moving average or a simple or weighted moving average
tvr的分布
低换手的alpha可能在时序上存在换手尖峰
earnings momentum alpha, meanwhile, will likely exhibit a cyclical turnover pattern, with spikes in activity around the most common times of earnings announcements.
examining whether the trades on the lower-turnover days are generating any meaningful value or should be filtered out, or whether the spikes can be smoothed out by gradually trading into the position over several days rather than making abrupt (binary) trades.
不同alpha间的cross效应,可以抵消一部分换手。单个alpha不必要加入这类限制条件去筛选。
A universe with more instruments will naturally have a higher probability of crossing. The frequency of crossing also depends on the turnover profile of the alphas. Alphas with sparser trading profiles will have fewer crossing opportunities, on average, than those with more uniform trading.
the exercise of testing and analyzing an alpha’s performance across different liquidity sets and under varying turnover levels can provide insights and confidence in that alpha’s robustness and tradability
8 Alpha Correlation
The correlation among alphas can be computed based on alpha PnL correlation or alpha value correlation.
ALPHA PnL CORRELATION
- Pearson Correlation Coefficient
- Temporal-Based Correlation
- larger weights are assigned to recent PnL values
- Generalized Correlation: we will consider nonlinear transformations, which typically modify the correlation between two variables.
ALPHA VALUE CORRELATION
it is enough to take d=20 days, so the alpha vector is of dimension 20 * the number of instruments in the universe.
- histogram of correlation : correlation density distribution is more important than a singular maximum value or even the average correlation value.
- T-corr is defined as the sum of the correlations of the given alpha with all other alphas.
- scaled average score
Two alphas may have highly correlated historical performance, but the future is uncertain and it is not always clear which one may add more value in the future.
using all these alphas at once may provide a more complete view of the idea and make the overall strategy more robust.
对于同一个single data,相关性可能很高,但每个alpha描述的侧面不一样,应该适当组合。
9 Backtest – Signal or Overfitting?
ten fold cross-validation, regularization, and prior probability. breaks the data into ten sets of size n/10, trains the model on nine datasets, and tests on one, then repeats the process ten times and takes the mean accuracy
If possible, it is better to test the model on a wider universe, where it should have a higher Sharpe
- Cross-validate on different instruments
- Make the model elegant
- Minimize parameters and operations
10 Controlling Biases
There are two important sources of systematic bias: look-ahead bias and data mining.
Any signal keyed off the occurrence datetime instead of the arrival datetime will ignore the real-world delays associated with getting the data, which may result in unrealistic simulations.
global strategies is the failure to record the time zone in which the data is timestamped.
quantitative investors should accept only historical data that is dual timestamped and thoroughly vet any data source that is subject to frequent revisions.
Data Mining
分离样本集,a time-series holdout or an asset holdout
After the holdout is incorporated into the backtest, a separate backtest is conducted solely on the holdout to vali- date whether the performance is consistent
should be no country, industry, size, or liquidity bias in the hold- out relative to the overall asset universe.
Storytelling
the tendency to fit an unverifiable story to justify performance.
Herding Bias
Herding is the propensity of investors to crowd into the same positions and has been identified as a key driver of financial bubbles.
11 The Triple-Axis Plan
TAP is really just a tool to organize the complex, multidimensional alpha space.
need a model to structure your search
- Ideas & Datasets
- Performance Parameters
- and Regions & Universes.
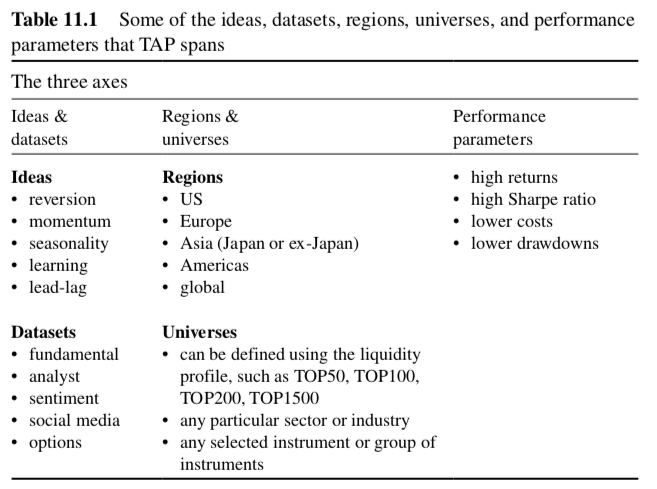
As a result, it can provide a quant with greater clarity and insight into the complex alpha space.
12 Techniques for Improving the Robustness of Alphas
A robust alpha should have the following properties:
- Invariance
- Robustness should not have excessively sharp declines in any of its performance benchmarks
Methodologies for robustness improvement can be classified into three categories: ordering methods, approximation to normal distribution, and limiting methods.
An ordinal scale of measurement is one that conveys order alone. These scales indicate only that one value is greater or less than another, so differences among ranks do not have meaning.
alphas based on nonparametric methodologies by nature require fewer assumptions and control parameters than their parametric alternatives.
Ranking Quantiles approximation
least quantile of squares (LQS) : ordinary least squares regression may be unstable for nonstationary and/or nonlinear inputs.
Approximation to Normal Distribution
- Fisher Transform formula: If F(x) is the Fisher transformation of x and N is the sample size, then F(x) approximately follows a normal distribution with stand- ard error1/ sqrt(N-3)
- Z-scoring: z=(x-u)/sigma
Limiting Methods: one aim of robust methods is to reduce the impact of outliers.
- simply remove a certain fraction of the data.
- Winsorizing is simi- lar to trimming, but we replace the extreme values with cutoff values rather than throwing them out.
- k-trimmed mean: trim a given proportion α from both ends of the dataset and then take the mean
- k-winsorized mean: replace a proportion k from both ends
roughly normal but contaminated with outli- ers and heavy tails. The methods can produce misleading results if they are applied to data that is inherently skewed or if a large proportion of the data is identical in value.
观察alpha值的分布(尽可能偏正态,不要有偏)
输入的data也一样